Up In The Air: The Safest Airlines For First-Time Flyers
This infographic presents an in-depth analysis of airline safety, focusing on metrics critical to first-time flyers and safety-conscious travelers. Leveraging historical data on crash rates, it offers insights into the past safety records of airlines from 1985 to 2014, providing a clear, data-driven approach to assess the reliability of airlines worldwide.
1. Objective and User Needs
Target Audience: First-time flyers or travelers looking for insights into airline safety.
Primary Goal: To visualize historical safety data in a manner that is digestible and actionable, enabling users to make informed travel decisions.
Secondary Goal: To educate users on how safety scores are calculated and to highlight any potential correlation between past incidents and future safety trends.
2. Design and Information Structure
Safety Score Calculation
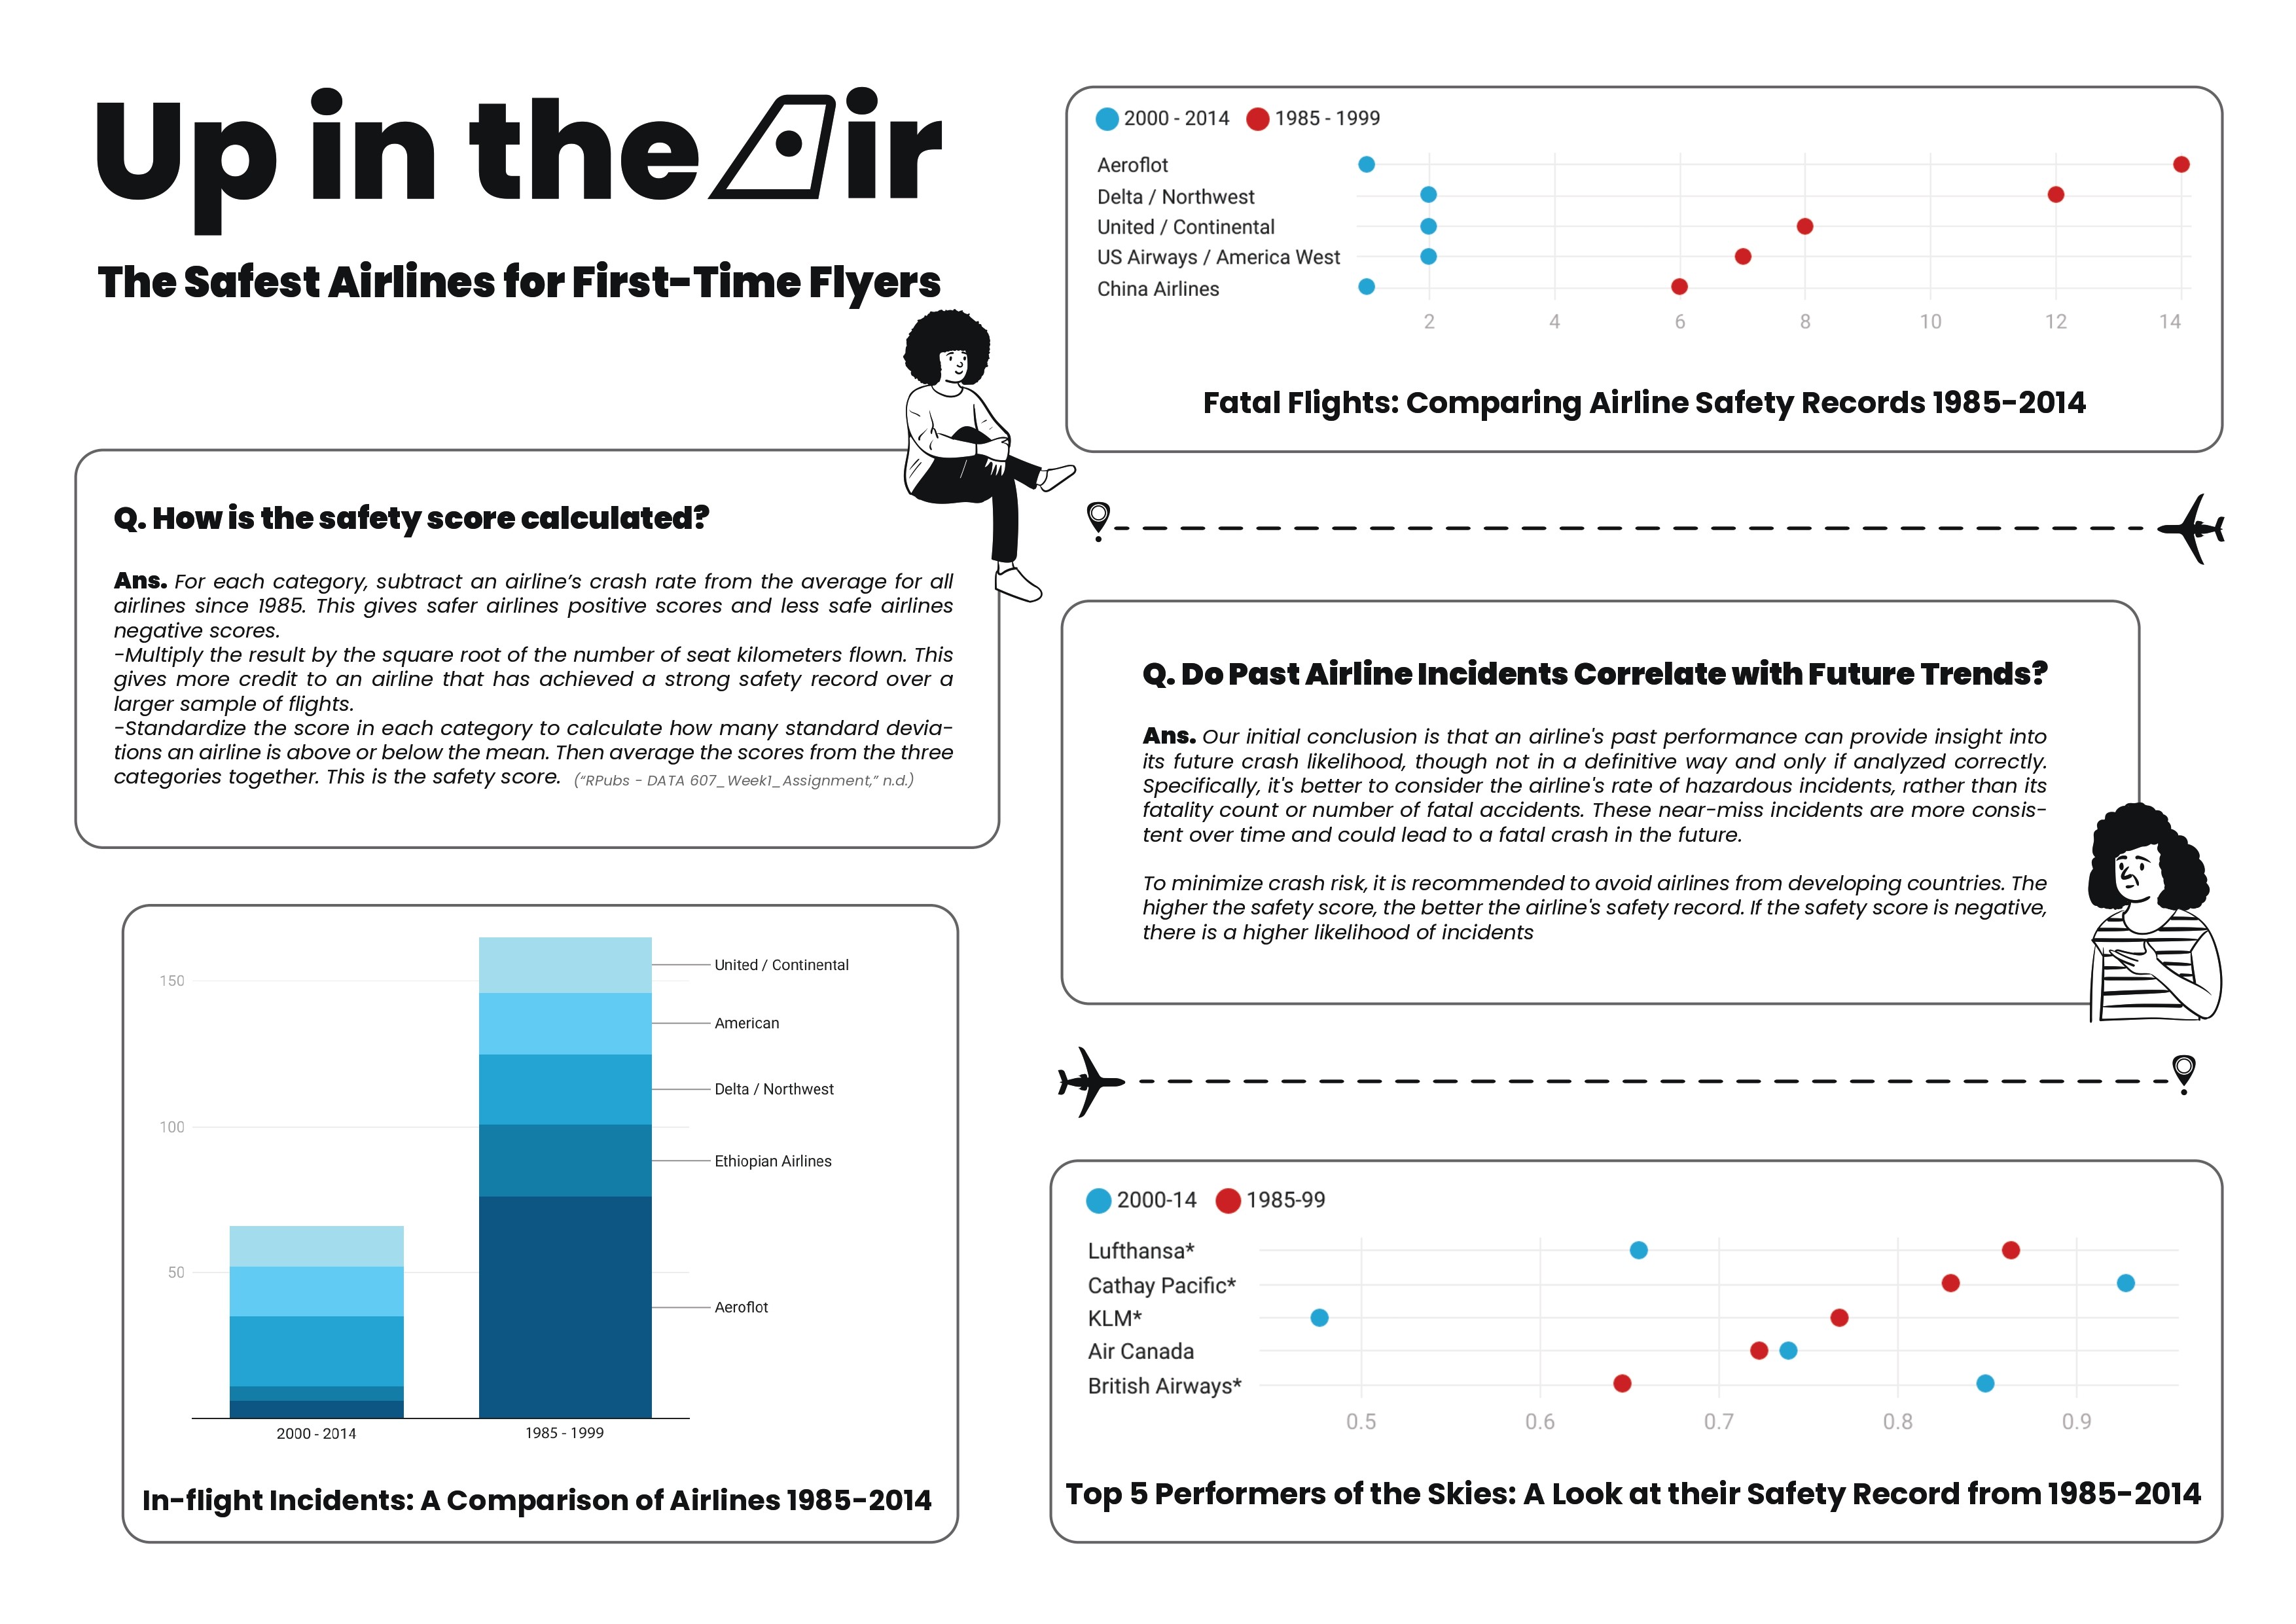
Methodology Explained: The infographic begins with a clear explanation of how the safety score is calculated. This is essential for transparency and helps users understand that the score isn’t arbitrary but based on a rigorous mathematical approach:
Crash Rate Comparison: Each airline's crash rate is adjusted against the industry average, creating positive scores for safer airlines.
Weighting for Sample Size: The score is adjusted based on the number of seat kilometers flown, ensuring that larger airlines with good safety records are rewarded for their extensive operations.
Standardization: Scores are standardized across categories, offering users a balanced perspective on airline safety.
User Insight: By demystifying the safety score, this section equips users with the knowledge to understand the statistical reliability of each airline's safety ranking.
Data Visualization and Historical Trends
Fatal Flights Visualization: This section compares fatal flights between two periods, 1985-1999 and 2000-2014, showing trends in airline safety over time. Airlines with the most fatal incidents are clearly highlighted, providing users with a quick overview of high-risk carriers.
In-Flight Incidents by Time Period: A bar graph offers a comparative analysis of in-flight incidents for airlines across the two time periods. This design choice allows users to easily identify improvements or regressions in airline safety, with United/Continental and American standing out as more reliable options.
Top Performers Visualization: A scatter plot displays the top five airlines based on safety scores, with distinctions for each time period. Airlines such as Lufthansa and British Airways are shown to have strong safety records, enabling users to identify consistently safe choices.
3. Key Insights for User Decision-Making
Impact of Past Incidents on Future Safety
Correlation Analysis: This section addresses whether past safety records can predict future trends, helping users understand the relationship between historical incidents and potential risk.
Takeaway for Users: While past performance doesn’t strictly determine future safety, the data shows that airlines with strong safety scores have historically maintained better safety records. Users are encouraged to avoid airlines with consistently poor safety scores, particularly those from developing countries, where incident rates have historically been higher.
Recommendation: The infographic recommends that users select airlines with positive safety scores to reduce crash risk, underscoring the importance of choosing well-established carriers with a strong record.
Guidance for First-Time Flyers
Actionable Data: For first-time flyers, the infographic provides a clear list of top-performing airlines, helping reduce anxiety by highlighting statistically safer options.
Focus on Transparency: The methodology section educates users on how scores are derived, building trust and giving users confidence in the data.
4. Visual and UX Design Considerations
Data Accessibility: Visual elements, such as color coding for different time periods and graphical representations of airline incidents, simplify complex data, making it more accessible and understandable for non-experts.
Minimal Cognitive Load: The layout is intentionally spacious, with each section focused on a single data insight, preventing information overload and making the infographic easier to follow.
Engagement Through Storytelling: The narrative structure of the infographic—beginning with methodology, followed by data visualization, and concluding with actionable insights—keeps users engaged while providing a logical flow for exploring the information.
5. Reflecting on the Design Process
This infographic exemplifies how UX design can transform complex datasets into accessible and actionable insights. By applying data visualization best practices and a user-centered design approach, I aimed to create an intuitive, visually appealing, and informative experience for users. The design empowers first-time flyers and safety-conscious travelers to make informed decisions, demonstrating the potential of UX design in data-driven storytelling.
Up In The Air: The Safest Airlines For First-Time Flyers
This infographic presents an in-depth analysis of airline safety, focusing on metrics critical to first-time flyers and safety-conscious travelers. Leveraging historical data on crash rates, it offers insights into the past safety records of airlines from 1985 to 2014, providing a clear, data-driven approach to assess the reliability of airlines worldwide.
1. Objective and User Needs
Target Audience: First-time flyers or travelers looking for insights into airline safety.
Primary Goal: To visualize historical safety data in a manner that is digestible and actionable, enabling users to make informed travel decisions.
Secondary Goal: To educate users on how safety scores are calculated and to highlight any potential correlation between past incidents and future safety trends.
2. Design and Information Structure
Safety Score Calculation
Methodology Explained: The infographic begins with a clear explanation of how the safety score is calculated. This is essential for transparency and helps users understand that the score isn’t arbitrary but based on a rigorous mathematical approach:
Crash Rate Comparison: Each airline's crash rate is adjusted against the industry average, creating positive scores for safer airlines.
Weighting for Sample Size: The score is adjusted based on the number of seat kilometers flown, ensuring that larger airlines with good safety records are rewarded for their extensive operations.
Standardization: Scores are standardized across categories, offering users a balanced perspective on airline safety.
User Insight: By demystifying the safety score, this section equips users with the knowledge to understand the statistical reliability of each airline's safety ranking.
Data Visualization and Historical Trends
Fatal Flights Visualization: This section compares fatal flights between two periods, 1985-1999 and 2000-2014, showing trends in airline safety over time. Airlines with the most fatal incidents are clearly highlighted, providing users with a quick overview of high-risk carriers.
In-Flight Incidents by Time Period: A bar graph offers a comparative analysis of in-flight incidents for airlines across the two time periods. This design choice allows users to easily identify improvements or regressions in airline safety, with United/Continental and American standing out as more reliable options.
Top Performers Visualization: A scatter plot displays the top five airlines based on safety scores, with distinctions for each time period. Airlines such as Lufthansa and British Airways are shown to have strong safety records, enabling users to identify consistently safe choices.
3. Key Insights for User Decision-Making
Impact of Past Incidents on Future Safety
Correlation Analysis: This section addresses whether past safety records can predict future trends, helping users understand the relationship between historical incidents and potential risk.
Takeaway for Users: While past performance doesn’t strictly determine future safety, the data shows that airlines with strong safety scores have historically maintained better safety records. Users are encouraged to avoid airlines with consistently poor safety scores, particularly those from developing countries, where incident rates have historically been higher.
Recommendation: The infographic recommends that users select airlines with positive safety scores to reduce crash risk, underscoring the importance of choosing well-established carriers with a strong record.
Guidance for First-Time Flyers
Actionable Data: For first-time flyers, the infographic provides a clear list of top-performing airlines, helping reduce anxiety by highlighting statistically safer options.
Focus on Transparency: The methodology section educates users on how scores are derived, building trust and giving users confidence in the data.
4. Visual and UX Design Considerations
Data Accessibility: Visual elements, such as color coding for different time periods and graphical representations of airline incidents, simplify complex data, making it more accessible and understandable for non-experts.
Minimal Cognitive Load: The layout is intentionally spacious, with each section focused on a single data insight, preventing information overload and making the infographic easier to follow.
Engagement Through Storytelling: The narrative structure of the infographic—beginning with methodology, followed by data visualization, and concluding with actionable insights—keeps users engaged while providing a logical flow for exploring the information.
5. Reflecting on the Design Process
This infographic exemplifies how UX design can transform complex datasets into accessible and actionable insights. By applying data visualization best practices and a user-centered design approach, I aimed to create an intuitive, visually appealing, and informative experience for users. The design empowers first-time flyers and safety-conscious travelers to make informed decisions, demonstrating the potential of UX design in data-driven storytelling.